Inequality in 700 Popular Films: Examining Portrayals of Gender, Race & LGBT Status from 2007 to 2014
Each year, USC Annenberg’s Media, Diversity, & Social Change Initiative produces a report examining gender and race/ethnicity on screen and behind the camera across the 100 top‐grossing fictional films. A total of 700 films and 30,835 characters have been analyzed across the 100 top‐grossing films of 2007, 2008, 2009, 2010, 2012, 2013, and 2014 (excluding 2011). All speaking or named characters were assessed for demographics, domestic traits, and hypersexualization. For the 100 top movies of 2014, we also examined qualitatively whether characters were portrayed as Lesbian, Gay, Bisexual, and/or Transgender (LGBT).
Turning to behind the camera, the gender of directors, writers, and producers of the 100 top films of 2014 was assessed. We also examined female and Black directors working across the 700 top films. This year, the prevalence of Asian directors was noted across the most popular movies as well. To date, this is clearly the most comprehensive longitudinal research report on gender and race/ethnicity across 700 top‐grossing films. Only differences of 5% or greater are noted to avoid making noise about trivial deviations (1‐2%).
Key Findings
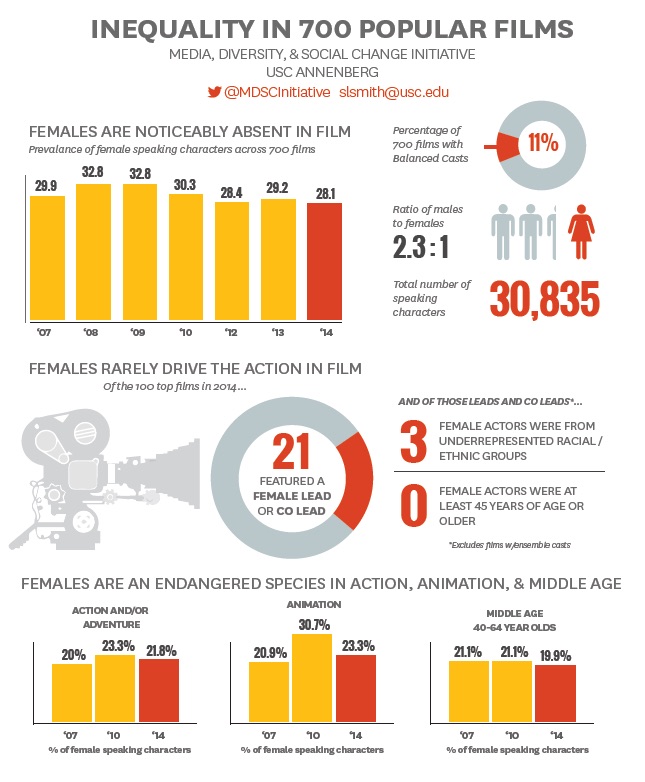
Gender. Only 30.2% of the 30,835 speaking characters evaluated were female across the 700 top‐grossing films from 2007 to 2014. This calculates to a gender ratio of 2.3 to 1. Only 11% of 700 films had gender‐balanced casts or featured girls/women in roughly half (45‐54.9%) of the speaking roles.
A total of 21 of the 100 top films of 2014 featured a female lead or roughly equal co lead. This is similar to the percentage in 2007 (20%), but a 7% decrease from the 2013 sample (28%).
In 2014, no female actors over 45 years of age performed a lead or co lead role. Only three of the female actors in lead or co lead roles were from underrepresented racial/ethnic backgrounds. No female leads or co leads were Lesbian or Bisexual characters.
Less than a quarter of all speaking characters were female in the top animated films of 2014, which is a 7.4% decrease from 2010 but no change from 2007. Only 21.8% of speaking characters in action/adventure films were female, which did not differ from 2010 or 2007. 34% of characters in 2014 comedies were female.
Across 700 films, a total of 9,522 characters were coded 40‐ to 64‐years of age. Less than a quarter (21.8%) of these characters were women. Only 19.9% of the middle‐aged characters were female across the 100 top films of 2014. This is not different from the percentage in 2007.
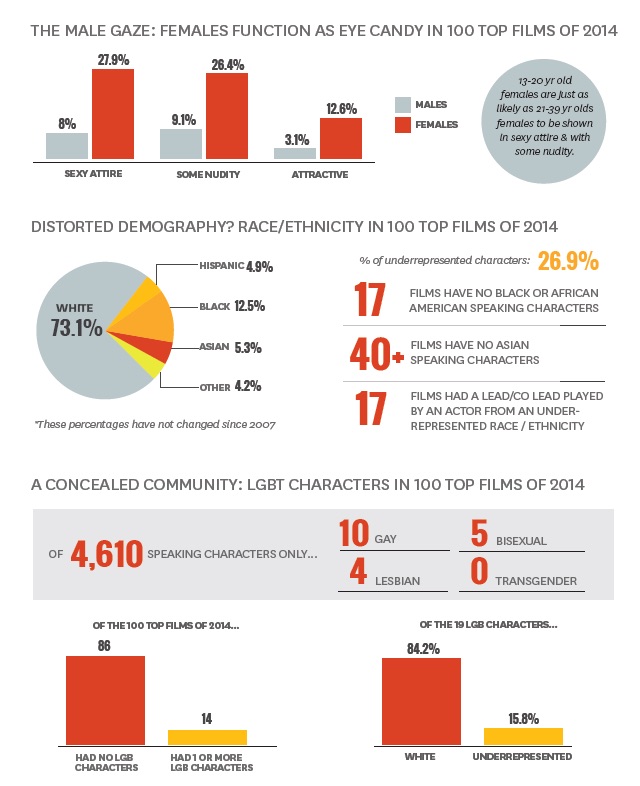
In 2014, females of all ages were more likely than males to be shown in sexy attire (27.9% of females vs. 8% of males), with some nudity (26.4% of females vs. 9.1% of males) and referenced as physically attractive (12.6% of females vs. 3.1% of males).
Examining patterns of sexualization by age in 2014 revealed that female teens (13‐20 year olds) were just as likely to be sexualized as young adult females (21‐39 year olds). Middle‐aged females (40‐64 year olds) were less likely than these two groups to be sexualized.
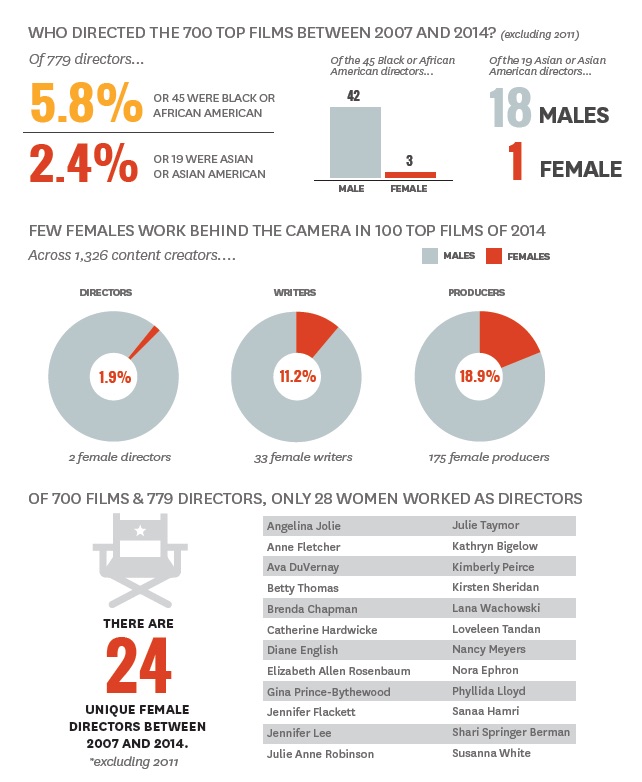
Across the 100 top films of 2014, only 15.8% of content creators working as directors, writers, and producers were women. Women only accounted for 1.9% of directors, 11.2% of writers, and 18.9% of producers. Put differently, only 2 women directed across the 100 top films of 2014. This is not different from 2013 (2 female directors across 100 top films) or 2007 (3 female directors across 100 top films). Twenty‐eight women have worked as directors across the 700 top films from 2007 to 2014. Only three were African American.
In the aggregate, films with at least one female screenwriter attached have more female characters and more women 40‐ to 64‐ years of age on screen than films without a female screenwriter attached. Also, films with a female lead or co lead were associated with more girls/women on screen than those without a female lead or co lead attached.
Race/Ethnicity. Of those characters coded for race/ethnicity across 100 top films of 2014, 73.1% were White, 4.9% were Hispanic/Latino, 12.5% were Black, 5.3% were Asian, 2.9% were Middle Eastern, <1% were American Indian/Alaskan Native or Native Hawaiian/Pacific Islander, and 1.2% were from “other” racial and/or ethnic groupings. This represents no change in the portrayal of apparent race/ethnicity from 2007‐2014.
Only 17 of the 100 top films of 2014 featured a lead or co lead actor from an underrepresented racial and/or ethnic group. An additional 3 films depicted an ensemble cast with 50% or more of the group comprised of actors from underrepresented racial/ethnic backgrounds.
Just over a quarter of characters in action and/or adventure (26.1%) and comedy films (26.5%) are from underrepresented racial/ethnic groups across the 100 top films of 2014. This represents no change from 2007 or 2010.
In comparison to top animated films of 2007, a 25.4% increase in the percentage of underrepresented characters was observed in the top animated films of 2014. However, over half of these 2014 characters appeared in one animated film, The Book of Life. Even without this movie, there is still a significant increase in the percentage of underrepresented speaking characters in animated films from 2007 to 2014.
In 2014, 17 films did not feature one Black or African American speaking character. This is the same number of movies without Black characters across the 100 top films of 2013. Over 40 movies across the 2014 sample did not depict an Asian speaking character.
Across the 100 top films of 2014, only 5 of the 107 directors (4.7%) were Black. One Black director helmed two pictures and only one was female. Only 45 Black directors have been attached to the 700 top‐grossing films. This represents 5.8% of all helmers in the years analyzed.
Only 19 Asian directors worked across the 700 top‐grossing films. This is an overall percentage of 2.4%. Only 1 Asian director was female across the films analyzed and was listed as a co‐director.
LGBT. Across 4,610 speaking characters in the 100 top films of 2014, only 19 were Lesbian, Gay or Bisexual. Not one Transgender character was portrayed. Ten characters were coded as Gay, 4 were Lesbian, and 5 were Bisexual. Only 14 movies sample wide featured an LGB depiction and none of those films were animated.
Of the LGB characters coded, nearly two‐thirds were male (63.2%) and only 36.8% were female. LGB characters were also predominantly White (84.2%). Only 15.8% were from underrepresented racial/ethnic backgrounds.
Click here to read article in full
Click on the images below to view in larger format